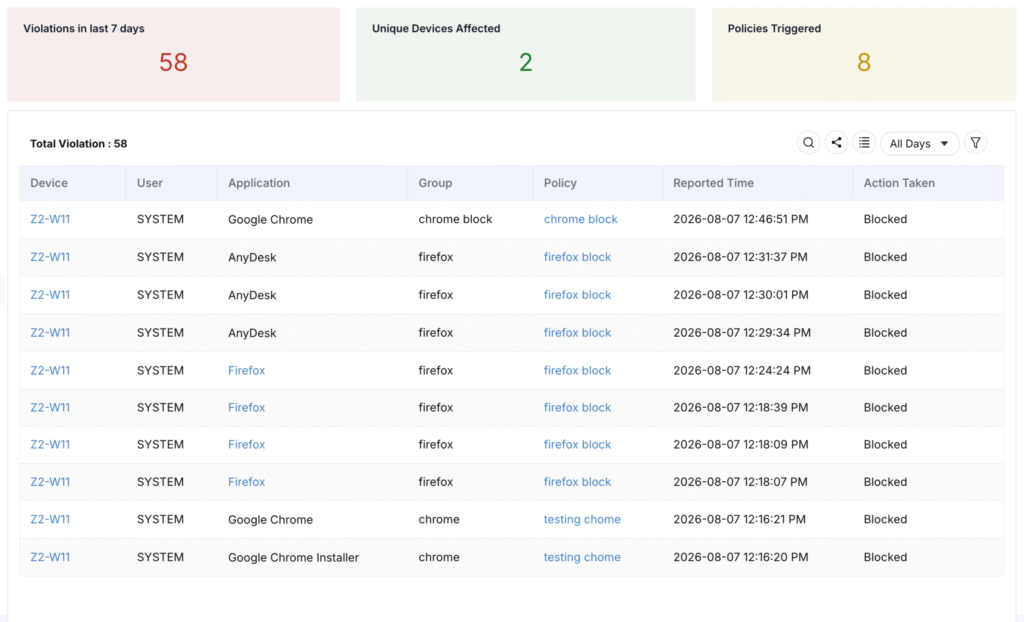
The Violations tab is the reporting and audit layer of Application Control. Every time a deployment policy blocks, warns, or logs an application event on a managed device, it’s recorded here, giving admins a real-time view of enforcement activity across the organization.
What Are Violations?
A violation is any event where a device attempted to run an application that matched a rule in an active application group, and a deployment policy acted on it. Depending on the policy’s Enforcement Action, that action may be a hard block, a user warning, or a silent log entry, all of which appear in this tab, with the specific outcome shown in the Action Taken column.
Where to Find It
- Log in to the Zecurit portal.
- Go to Endpoint Manager → Application Control.
- Select the Violations tab, alongside Application Group and Deployment.
The Violations tab requires no additional setup. It automatically populates once any deployment policy is published and begins enforcing.
Summary Metrics
Three summary cards appear at the top of the page, reflecting the currently selected time range:
| Metric | Description |
|---|---|
| Violations in last 7 days | Total count of all logged enforcement events in the period |
| Unique Devices Affected | Number of distinct devices that generated at least one violation |
| Policies Triggered | Number of distinct deployment policies that fired at least once |
These metrics give a fast health check: a high violation count concentrated on very few devices often points to a misbehaving application or a misconfigured policy, rather than widespread risky behavior.
Violations Table Columns
| Column | Description |
|---|---|
| Device | Hostname of the endpoint where the event occurred |
| User | User account context under which the application attempted to run (e.g., SYSTEM) |
| Application | Name of the application involved (e.g., Microsoft Edge, Google Chrome) |
| Application Version | Detected version of the application, or “Unknown” if not captured |
| Group | The application group whose rule matched (e.g., Edge, chrome) |
| Policy | The specific deployment policy that triggered enforcement (e.g., edge, chrome) |
| Reported Time | Timestamp the event was reported to the portal |
| Action Taken | The enforcement outcome (e.g., Blocked) |
Filtering and Searching
The toolbar above the table provides several ways to narrow results:
| Control | Function |
|---|---|
| Search icon | Search violations by device, user, or application name |
| Share icon | Export or share the current filtered view with other stakeholders |
| List/view icon | Toggle between table and alternate display views |
| Date range dropdown (e.g., “All Days”) | Restrict results to a specific time window |
| Filter icon | Apply advanced filters, such as by Group, Policy, or Action Taken |
Narrowing by date range and policy is especially useful when validating a newly published policy, since it isolates only the events that policy generated.
Reading a Violation Record
A single violation row tells a complete story of one enforcement event. For example:
Device Ken, running as user SYSTEM, attempted to launch Microsoft Edge. This matched the Edge application group via the edge policy, was reported at 11:10:38 AM, and the action taken was Blocked.
Repeated identical rows for the same device and application typically indicate either a background or auto-launch process retrying repeatedly, or a user repeatedly attempting to open a blocked application.
Example Violation Entries
| Device | Application | Group | Policy | Action Taken |
|---|---|---|---|---|
| Ken | Microsoft Edge | Edge | edge | Blocked |
| Alex | Google Chrome | chrome | chrome | Blocked |
| Surya | Google Chrome | chrome | chrome | Blocked |
Responding to Violations
| Observation | Suggested Response |
|---|---|
| High volume of violations from one device | Investigate the device for repeated auto-launch behavior (e.g., a startup item relaunching a blocked browser) |
| Violations for a business-critical application | Reassess whether the application group or policy scope is too broad, and add an exception if needed |
| Violations concentrated on one user account | Reach out to the user or their manager to confirm intended use and provide guidance |
| Sudden spike in violations for a new application | Confirm whether a new application group or policy was recently published, or investigate as a potential new risk |
Best Practices
- Check the Violations tab shortly after publishing any new policy to confirm it’s behaving as expected.
- Use the date range and policy filters to isolate noise from a single misconfigured rule.
- Periodically review high-frequency violations for patterns that suggest a policy needs an exception rather than a user needing correction.
- Export violation data regularly if your organization requires audit trails for compliance reporting.
Troubleshooting Tips
| Issue | Resolution |
|---|---|
| No violations appearing despite a published policy | Confirm the target scope includes the devices being tested, and that the Enforcement Action isn’t set to a non-logging state |
| Application Version shows “Unknown” | This is expected when the agent cannot read version metadata from the executable; matching still functions via other rule data |
| Too many duplicate rows for the same event | Check whether the blocked application is configured to auto-relaunch, generating repeated attempts |
| Can’t find a specific violation | Widen the date range filter, or search directly by device or application name |